Overview
View reports to visualize your data.
Reporting is in an active beta. We are developing more reports and other reporting features, such as table views, custom reports, and computed fields.
Before using reporting, you can customize your reporting settings here.
Reports
There are multiple out-of-the-box reports, which we’ll explain below.
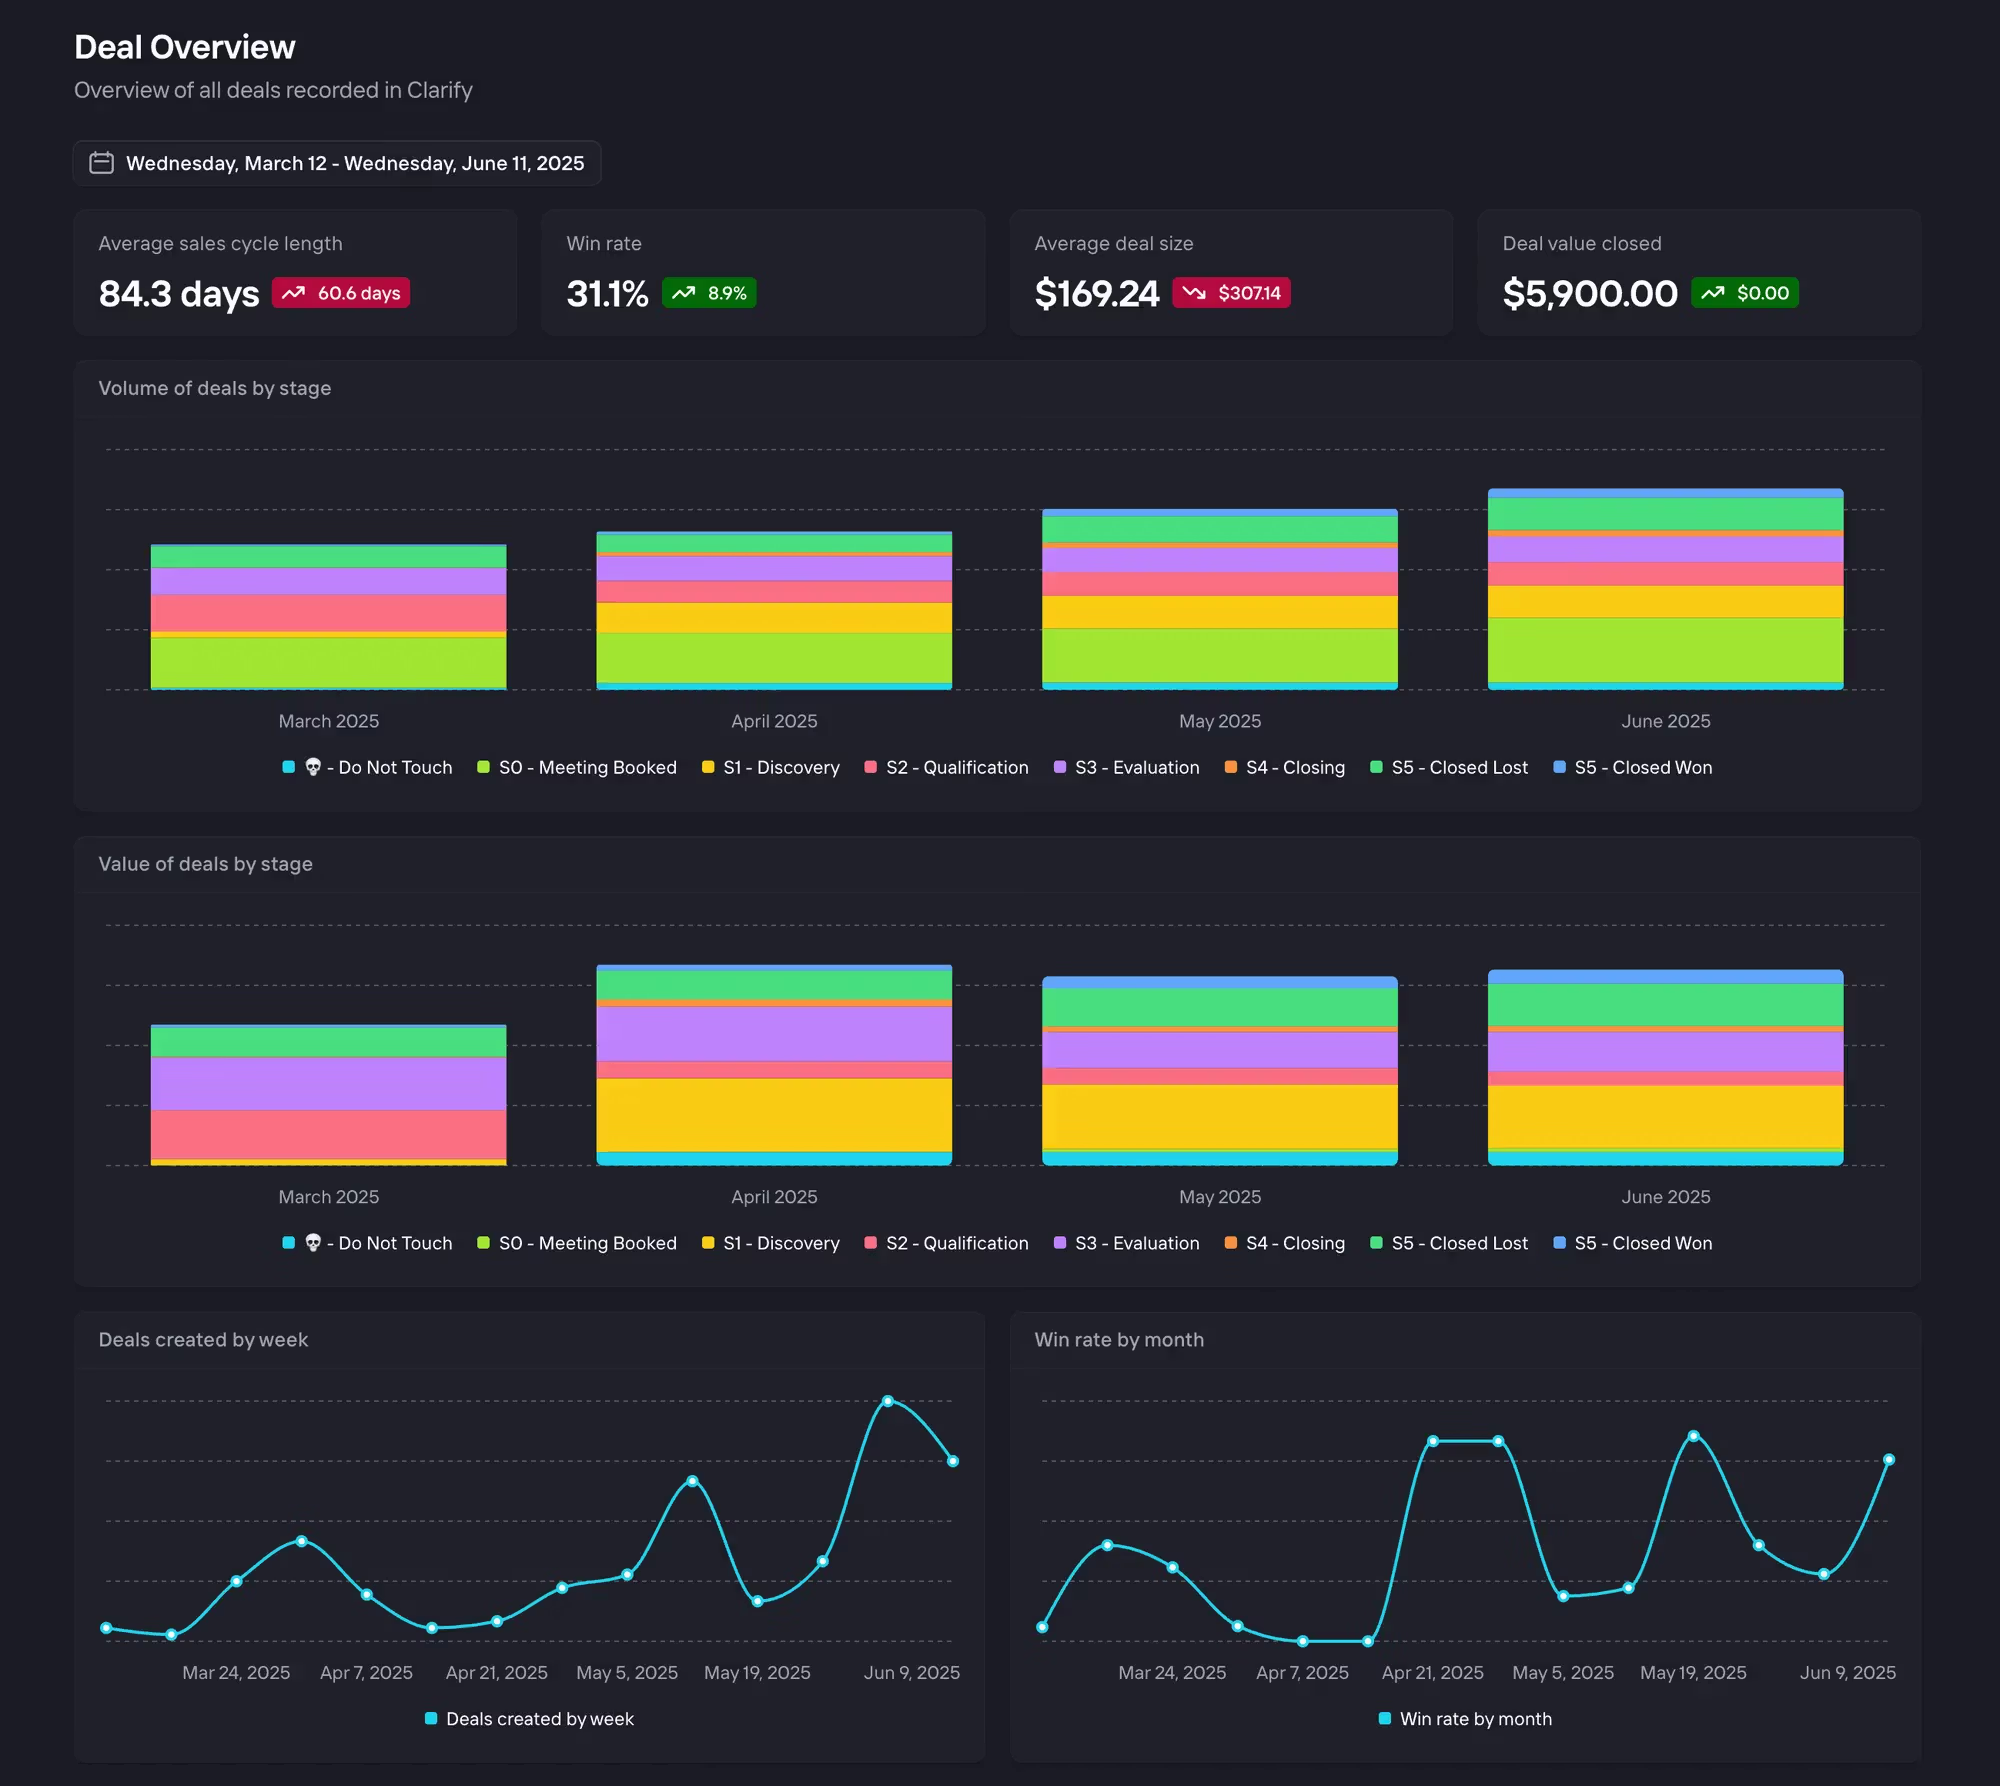
Deal overview
The purpose of the deal overview dashboard is to look backward at the history of deals. Here is an explanation of each chart.
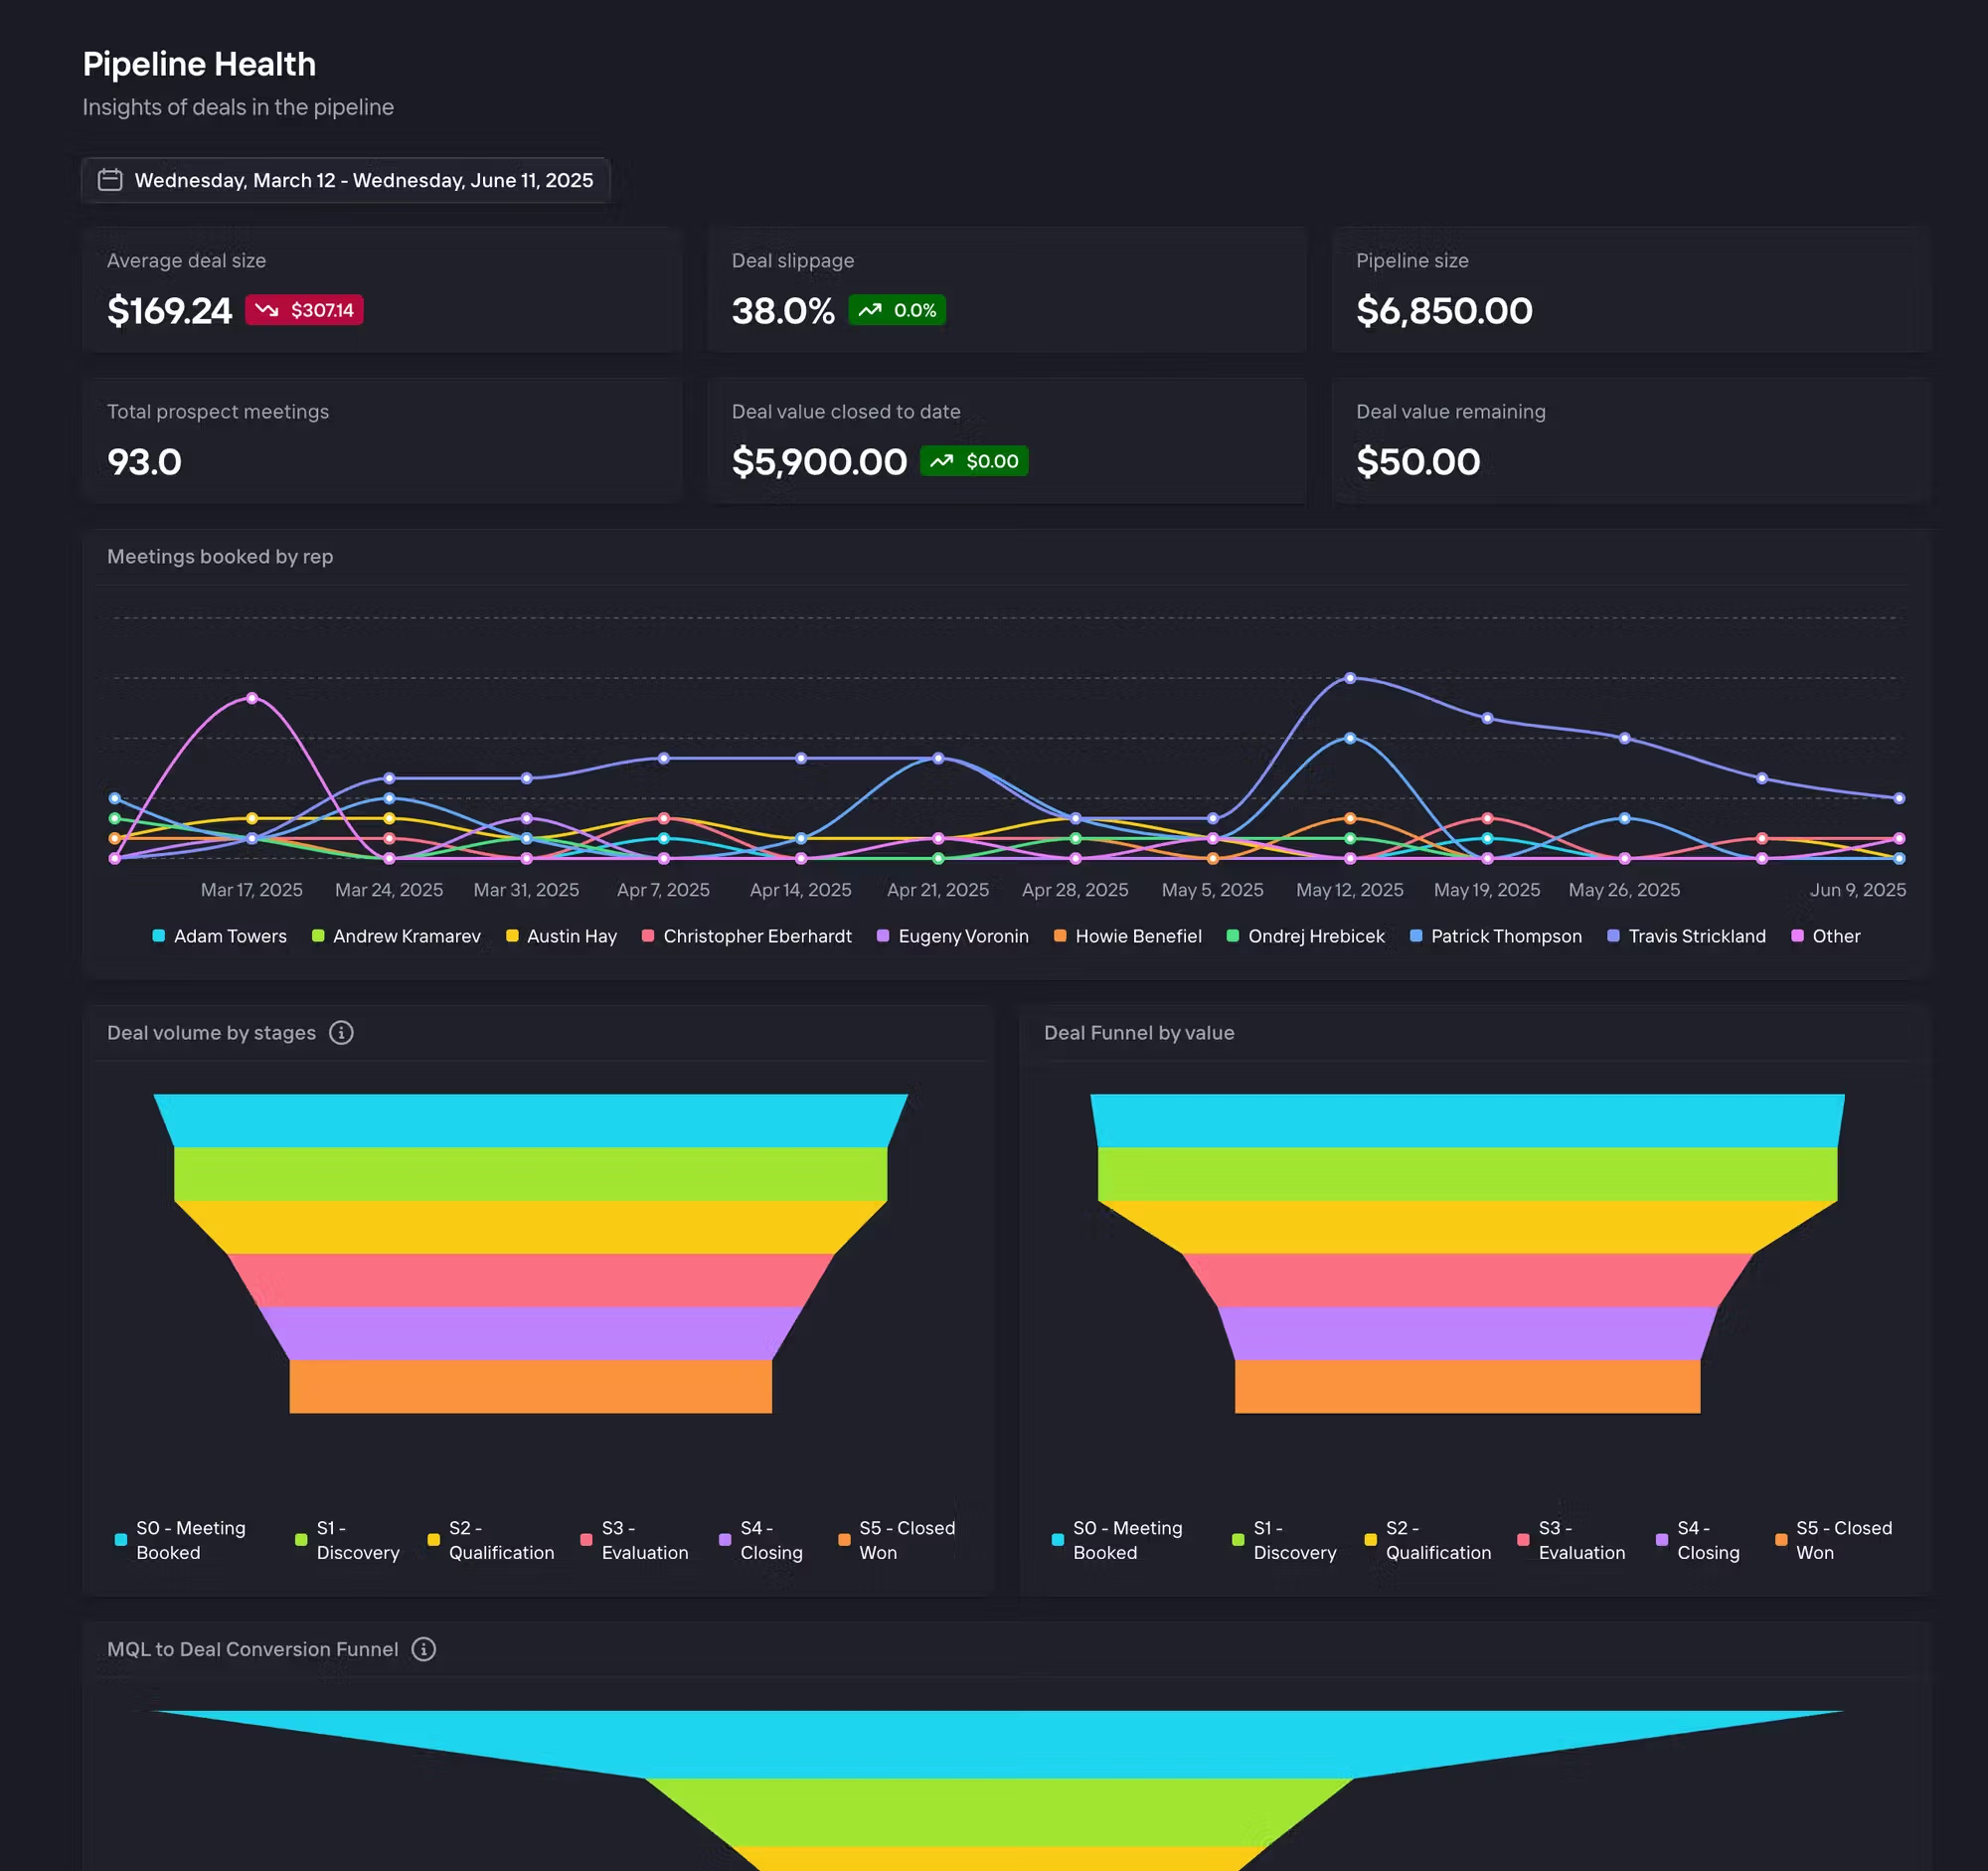
Pipeline health
The purpose of the pipeline health dashboard is to look forward at your deals for the current quarter. In general, these charts will look at deals that have a close date within the specified time range. A recommended time range for this dashboard is the current quarter.
Warehouse
Bring your own BI: Access your data, your way
Clarify gives you direct access to your warehouse so you can build custom reports using whatever BI tool you prefer—Metabase, Hex, Tableau, you name it. We sync all your data into a clean, analysis-ready schema, so you’re free to slice, dice, and explore without limitations.
Need to track pipeline influence? Visualize rep activity across segments? Run your own conversation outcome analysis? No problem. With warehouse access, you’re in control: use the tools you already love, integrate with your internal dashboards, and ask the questions that matter most to your team.