Pipeline health
Gives you a look forward at your upcoming deals.
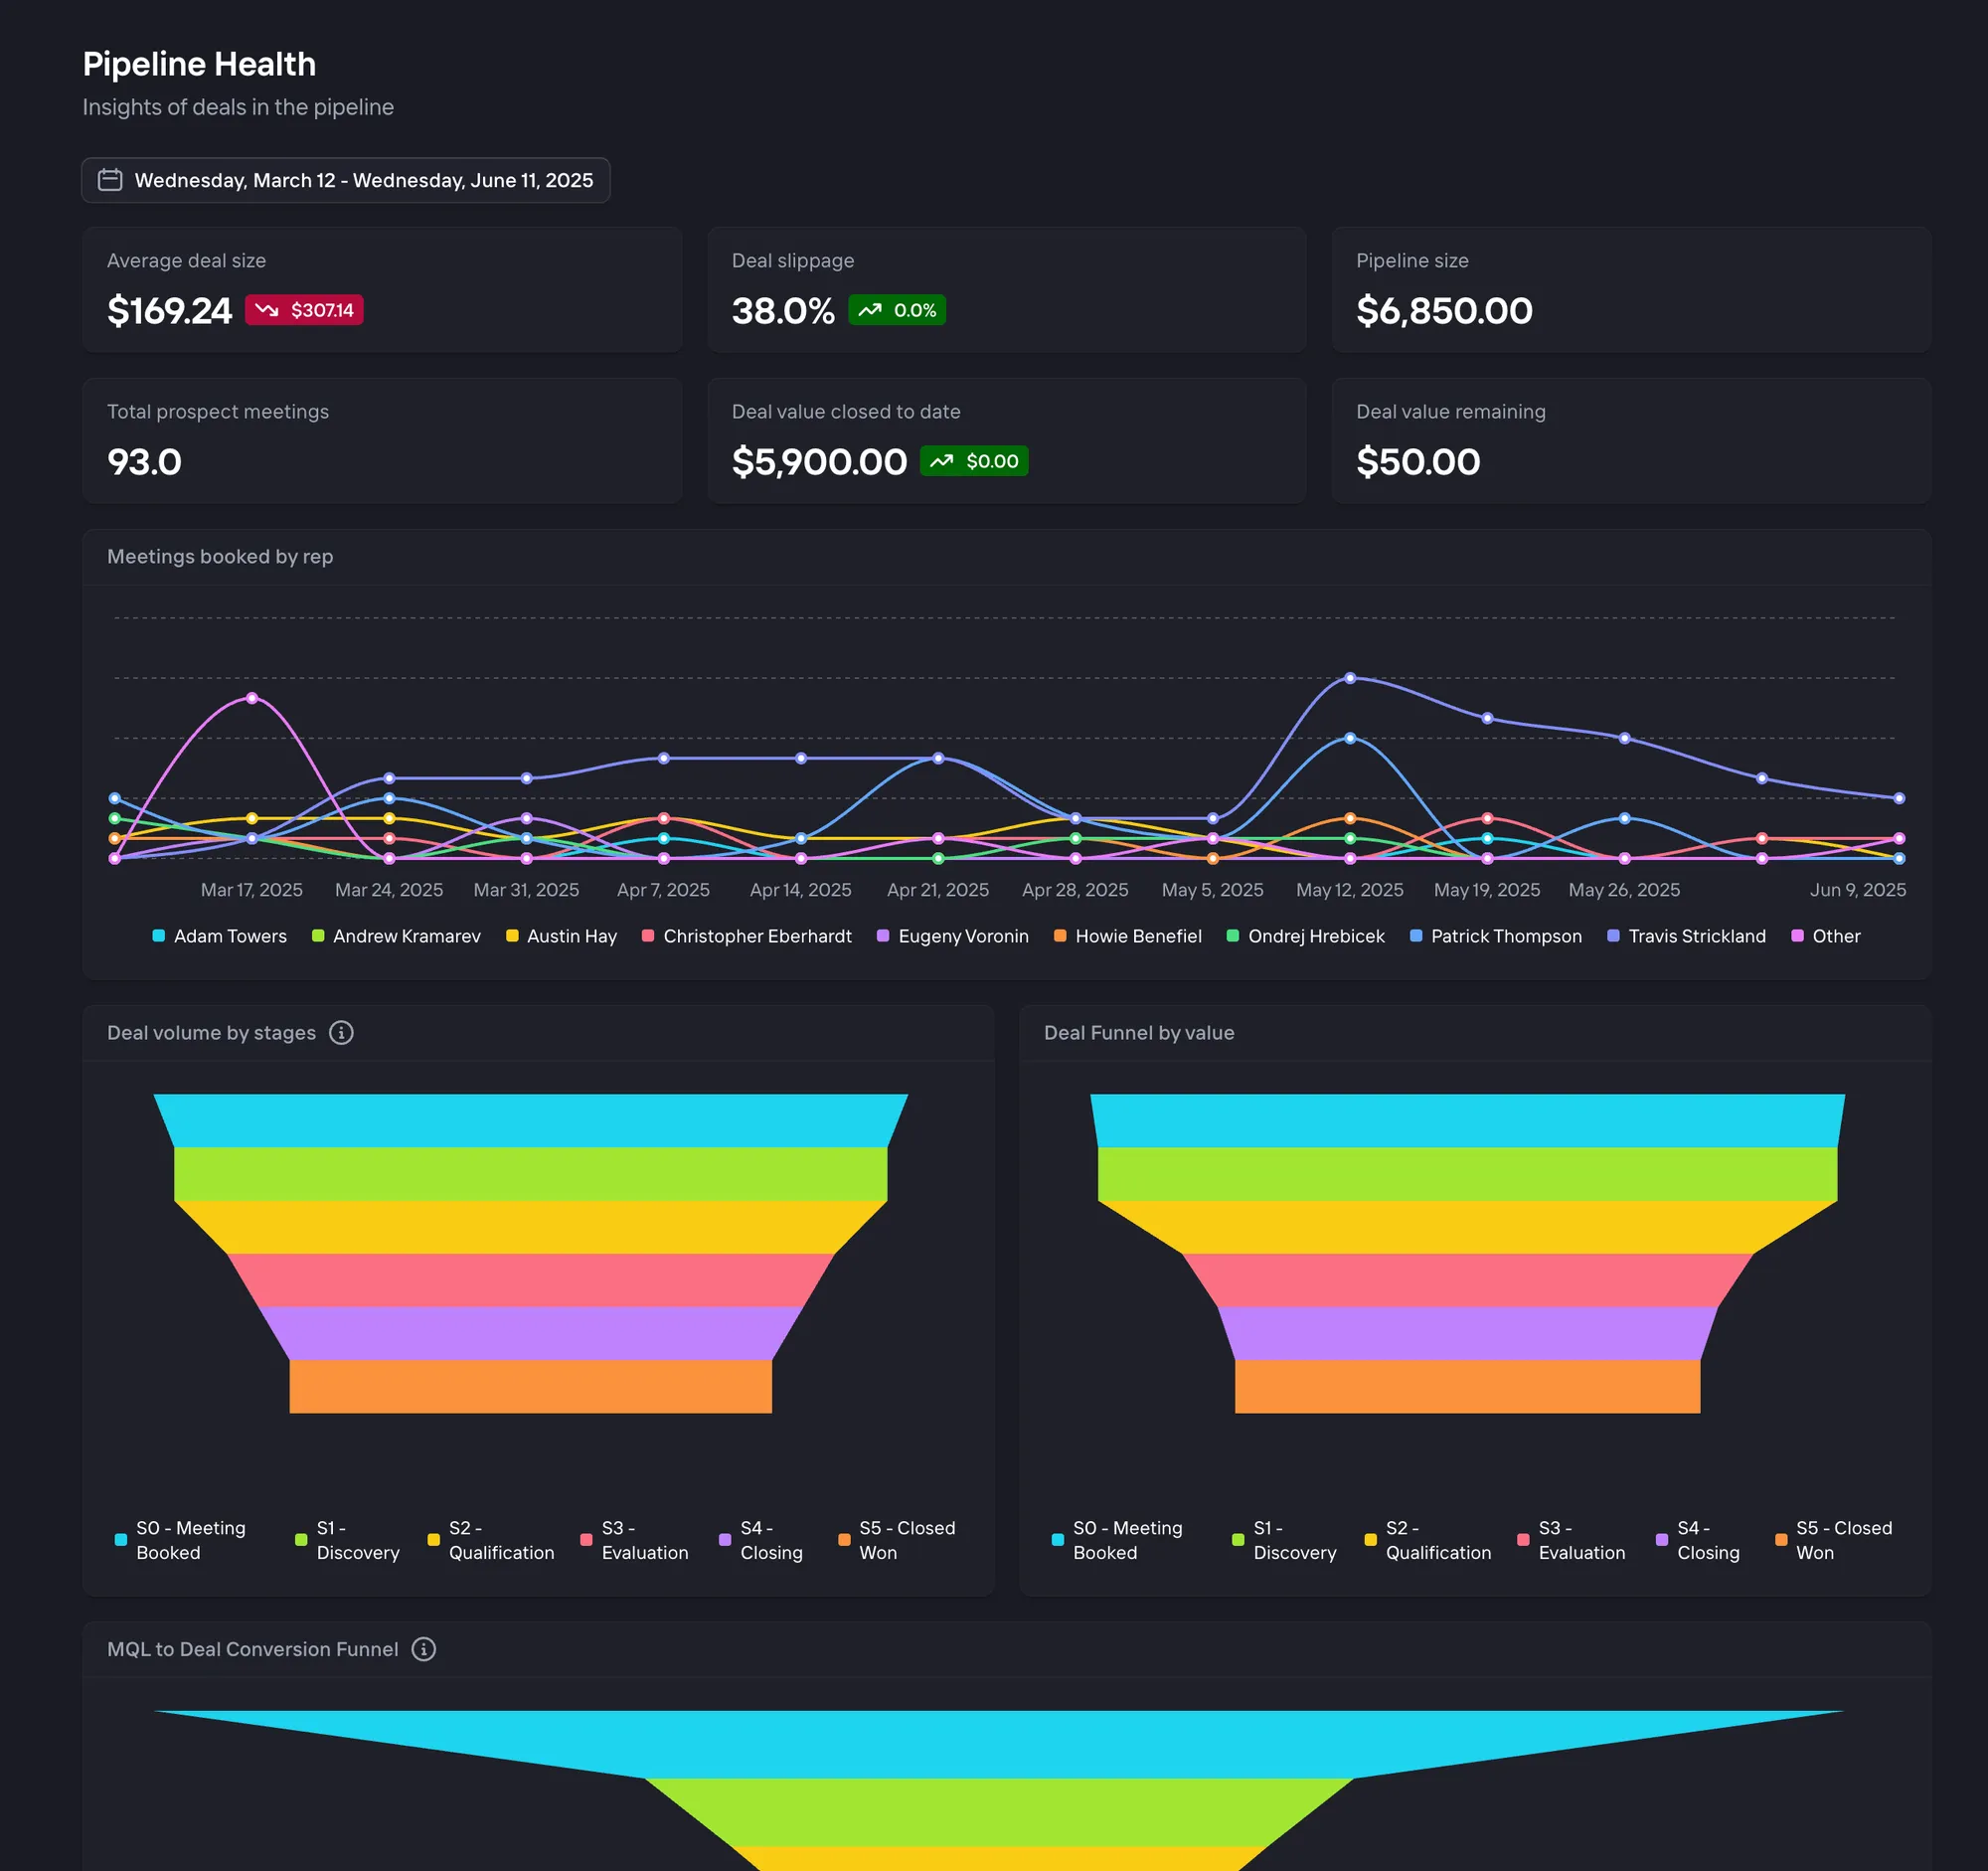
The purpose of the pipeline health dashboard is to look forward at your deals for the current quarter. In general, these charts will look at deals that have a close date within the specified time range. A recommended time range for this dashboard is the current quarter.
Average deal size
This metric shows the average deal size for any deal that has a close date in the given time range.
Deal slippage
This metric shows the % of deals which had their close date moved back within the time range. More specifically, this shows the percent of deals that have a close date in the current time range and, at least once in the time range, had their close dates moved back.
Pipeline size
This is a simple sum of deal amounts for deals that have a close date in the given time range.
Total prospect meetings
This metric shows the number of meetings that anyone in your organization had with a person at a company where there is a deal with a close date in the given time range.
Deal value closed to date
This metric sums up the deal amount of deals that were closed since the beginning of the time range to now.
Deal value remaining
This metric sums up the deal amount of any deals that have a close date from now until the end of the given time range.
Deal value funnel
This chart visualizes the total monetary value of deals at each stage of the sales pipeline.
The calculation sums the amounts of all deals at each stage, excluding deals marked as "Closed Lost". The chart shows the total value of deals that have reached or passed each stage.
Prospect meetings by rep
This chart breaks down the number of prospect meetings by sales representative over time.
The calculation counts the number of meetings conducted by each sales representative within specified time intervals, excluding canceled meetings.